Agriculture · radar · yield
Maize and Sentinel-1 — State of Mexico, 2020-2025
Can Sentinel-1 estimate maize yield? A feasibility study over three rural development districts of the State of Mexico (Atlacomulco, Jilotepec and Toluca: 41 municipios, 8,167 km²) and six maize seasons, from 2020 to 2025, presented in a public bilingual web application.
GeoStratify · feasibility study · 2026
Open application, in French and English.
Key results
1A maize mask consistent with the statistics
From one municipio to another, the detected areas follow those of SIAP (correlation of 0.93 to 0.97 depending on the year). The retained area ranges from 145,000 to 166,000 ha depending on the year, i.e. 52 to 58% of the declared area (98,000 ha and 33% in 2020).
2Sentinel-1 sees the crop through clouds
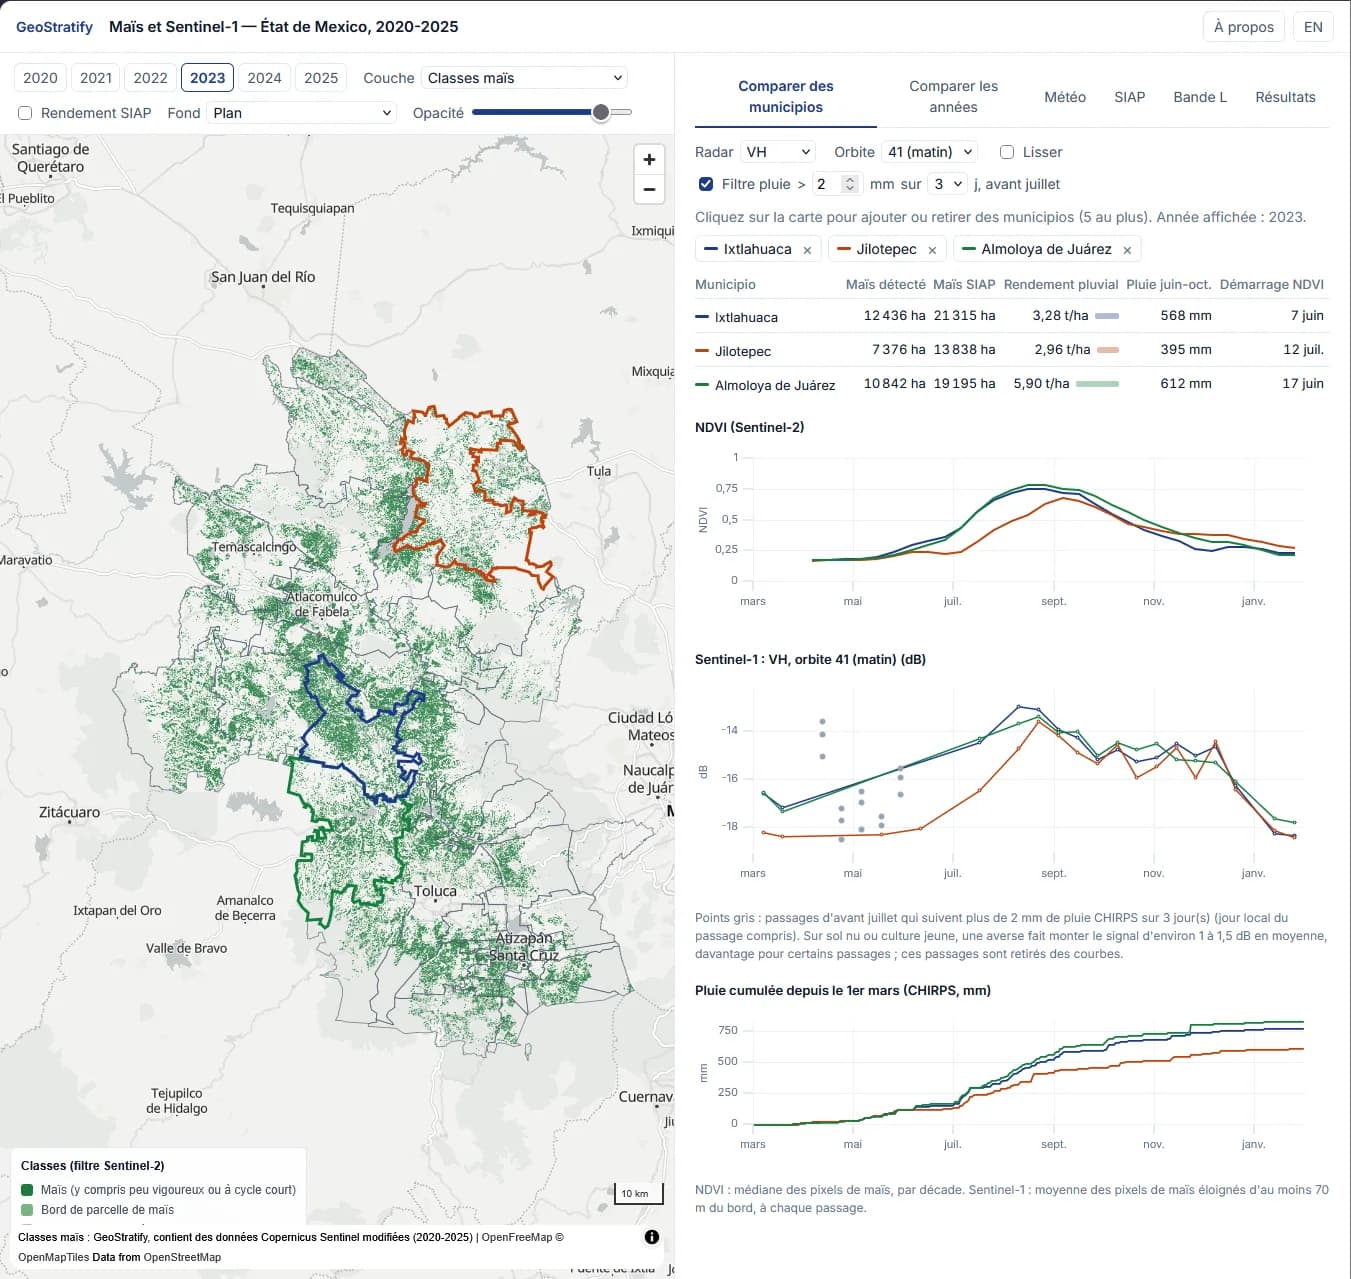
The rise of the VH signal follows the NDVI green-up, and the VH level in August-October follows the NDVI peak. The morning orbit is clearer than the evening one.
3Rain disturbs the radar while the soil is visible
On bare soil, a shower raises the signal by about 1 to 1.5 dB. The effect becomes small once the maize has grown, and the VH/VV ratio is barely sensitive to it.
4Municipal yield remains hard to predict
Rainfed yield varies mostly from one municipio to another (standard deviation 0.74 t/ha) and little from year to year (0.42 t/ha). The historical average of each municipio has an error of 0.51 t/ha; neither Sentinel-1, Sentinel-2 nor weather does clearly better (0.49 to 0.50 t/ha, a gain of 9% at most, with weather).
5L-band shows a stronger crop contrast
Between bare soil and crop plateau, NISAR's HV signal gains 6 to 7.5 dB, against 4 to 4.5 dB for VH with Sentinel-1: a contrast almost twice as strong.
The key point
Satellites map maize well and track its growth, even under clouds with radar. But at municipal level, yields vary too little from year to year for satellites to bring a gain. Field-level data is needed to go further.
What the application does
Compare municipios
10 m maize map and NDVI, Sentinel-1 and rainfall time series, for up to 5 municipios. A rain filter removes radar passes that follow a shower.
Compare years
The six seasons of a municipio overlaid.
Weather
Climate indicators per municipio (rainfall, rainy season onset, dry spell, temperatures, degree-days, soil moisture), compared with yield.
SIAP
Official agricultural statistics (areas, yields), compared with satellite-detected maize.
L-band
NISAR 2026 and ALOS-2 2020-2025 radar, compared with Sentinel-1 2026 over the same maize.
The map
Three layers (maize classes, vegetation green-up date, NDVI peak), three display levels (10 m pixels, 1 km² hexagons, municipios) and a base map or satellite image.
How it works
01
Cropland mask
Agreement of at least two of three global products: ESA WorldCover, WorldCereal and Dynamic World.
02
Maize
Annual phenological filter on Sentinel-2 NDVI time series: bare soil in spring, rise, peak, cycle length. It favours purity: small fields, edges and intercropping are deliberately left out.
03
Sentinel-1
VV and VH averaged per municipio over maize pixels at least 70 m from the edge.
04
Comparisons
SIAP municipal statistics and daily CHIRPS and ERA5-Land weather.
05
L-band
NISAR (NASA-ISRO): provisional GCOV products, 10 m, one pass every 12 days per orbit, from November 2025 to October 2026. ALOS-2 PALSAR-2 ScanSAR (JAXA): 25 m, 2020-2025.
06
Processing
About 250 GB of data cubes on a 10 m grid, processed on a Google Cloud virtual machine.
The data in figures
- 10 m grid, 157 million pixels, January 2020 to March 2026
- Sentinel-2: 3,041 scenes, 905 dates
- Sentinel-1: 1,319 scenes, 728 passes
- ALOS-2: 272 scenes, 140 dates
- NISAR: 111 products, 56 passes
- Daily weather from October 2019 to October 2026 for the 41 municipios
Sources
- Copernicus Sentinel-1 and Sentinel-2 (via Microsoft Planetary Computer)
- ESA WorldCover and WorldCereal, Google Dynamic World
- ALOS-2 PALSAR-2 © JAXA (via Google Earth Engine)
- NISAR GCOV (NASA-ISRO, ASF DAAC)
- CHIRPS, ERA5-Land (Copernicus Climate Change Service), SIAP, INEGI
- Contains modified Copernicus Sentinel data (2020-2026)
Known limitations
- The mask favours purity: it retains 52 to 58% of the declared maize area depending on the year.
- Yields are only known at municipio level (SIAP), not at field level.
- NISAR products are provisional and only cover November 2025 to October 2026.
Going further
- Obtain field-level yields.
- Test radar where optical imagery fails: very cloudy seasons, emergence and harvest dates.
- Extend the series (2017-2019).
Role
- Study design
- Data processing
- Application development
Technologies
Sentinel-1 · Sentinel-2 · SAR radar · L-band · NISAR · ALOS-2 · Google Cloud · Web application
Context
Feasibility study carried out by GeoStratify in October 2026. The public application, in French and English, presents the data, the method and the results.
A similar need?
These applications can serve as the basis for a tool adapted to your data, your area or your question.