Climate · agriculture · risk
Monitoring rainfall and drought in Kenya
Where is rain lacking, and has the season started? The application answers across Kenya from CHIRPS rainfall estimates, monthly since 2005 and per pentad since 2019, and replays an index insurance contract over past years.
Expertise France · 2026
Who it is for
Designed for meteorological and agricultural services monitoring the season, and for index insurance programmes that want to test a contract on past years.
What the application does
Drought
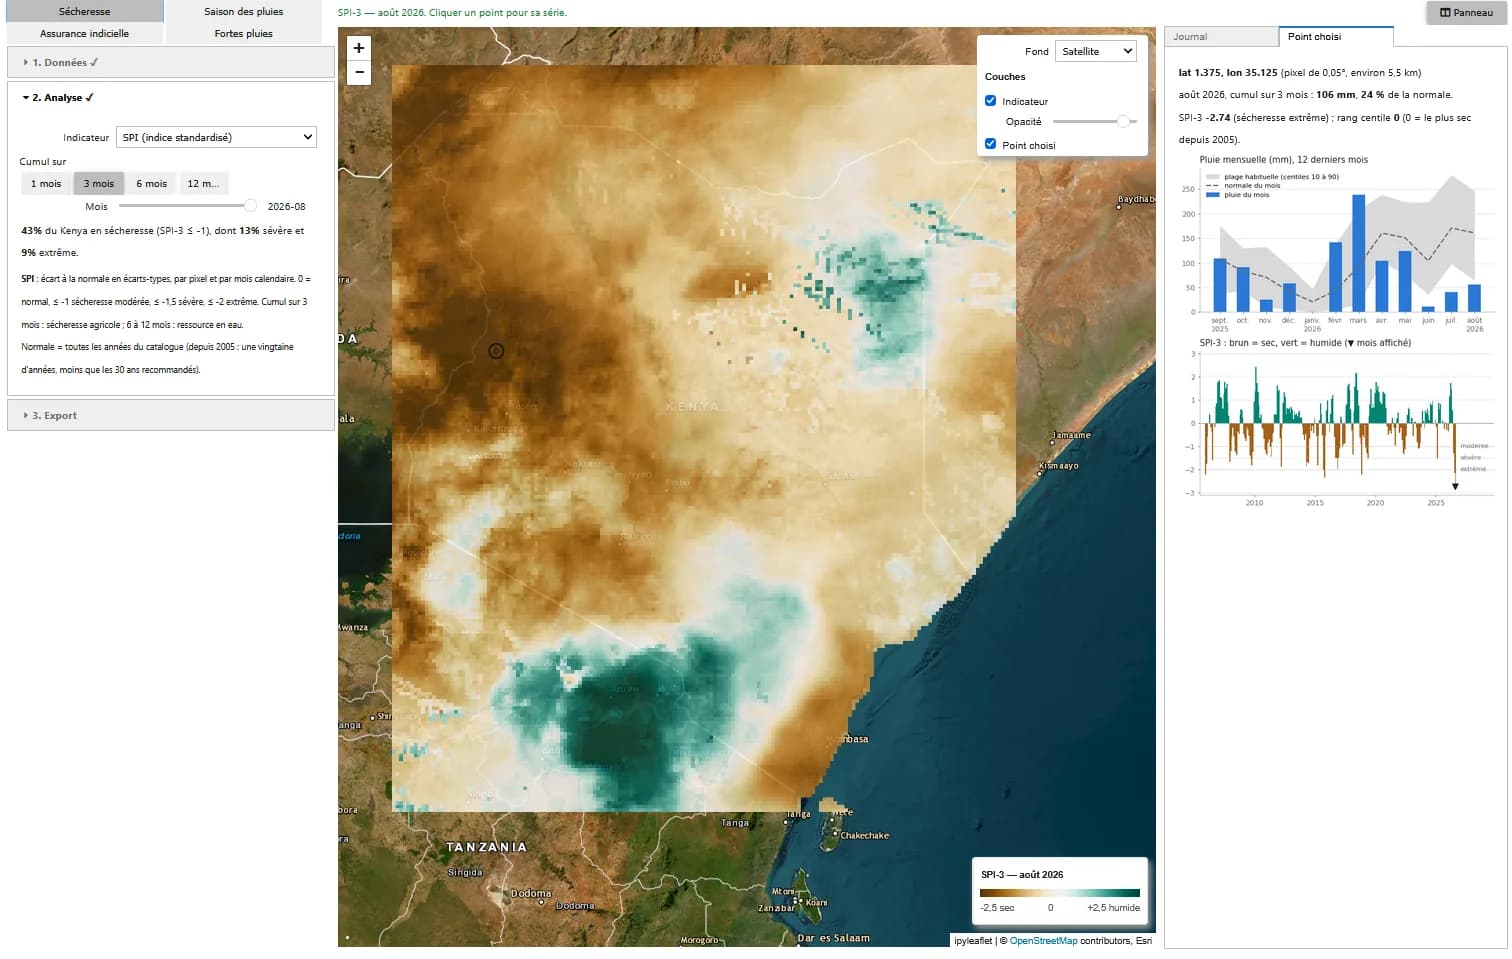
SPI over 1, 3, 6 or 12 months (gamma distribution fitted per pixel and calendar month), rainfall as % of normal, percentile rank, and share of Kenya in moderate, severe or extreme drought.
Rainy season
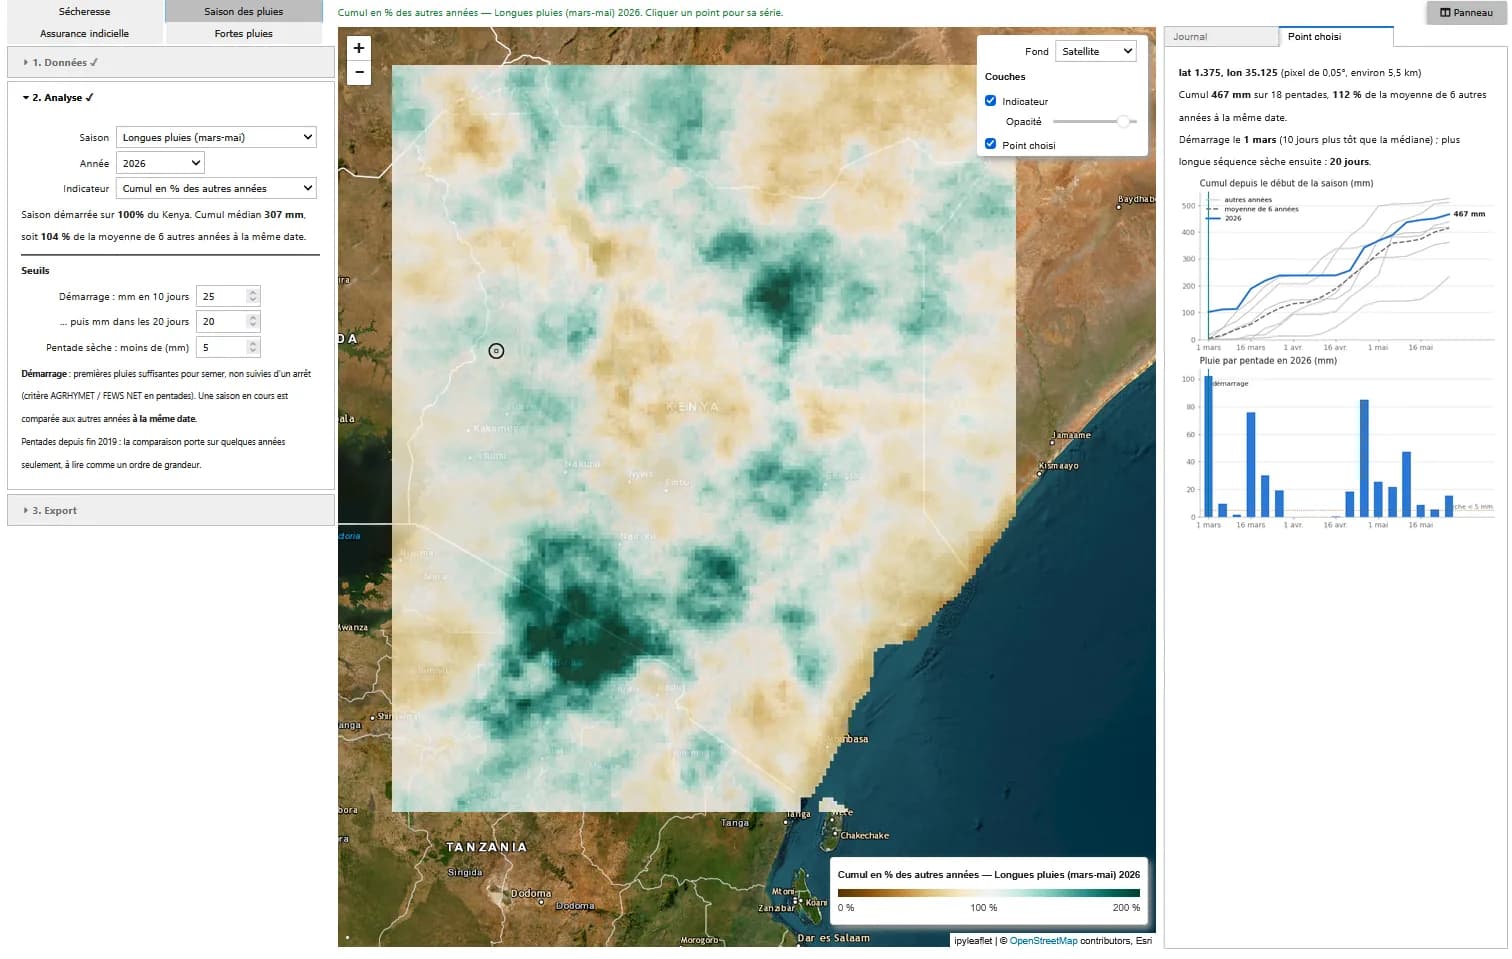
Onset: 25 mm in 10 days, then 20 mm in the following 20 days (AGRHYMET / FEWS NET criterion adapted to pentads, adjustable thresholds). Seasonal total, longest dry spell, comparison with other years at the same date.
Index insurance
Trigger and exit as % of the pixel's normal (80% and 40% by default), contract replayed over each complete season since 2005: payout of the year, trigger frequency, pure premium excluding costs and margin.
Heavy rainfall
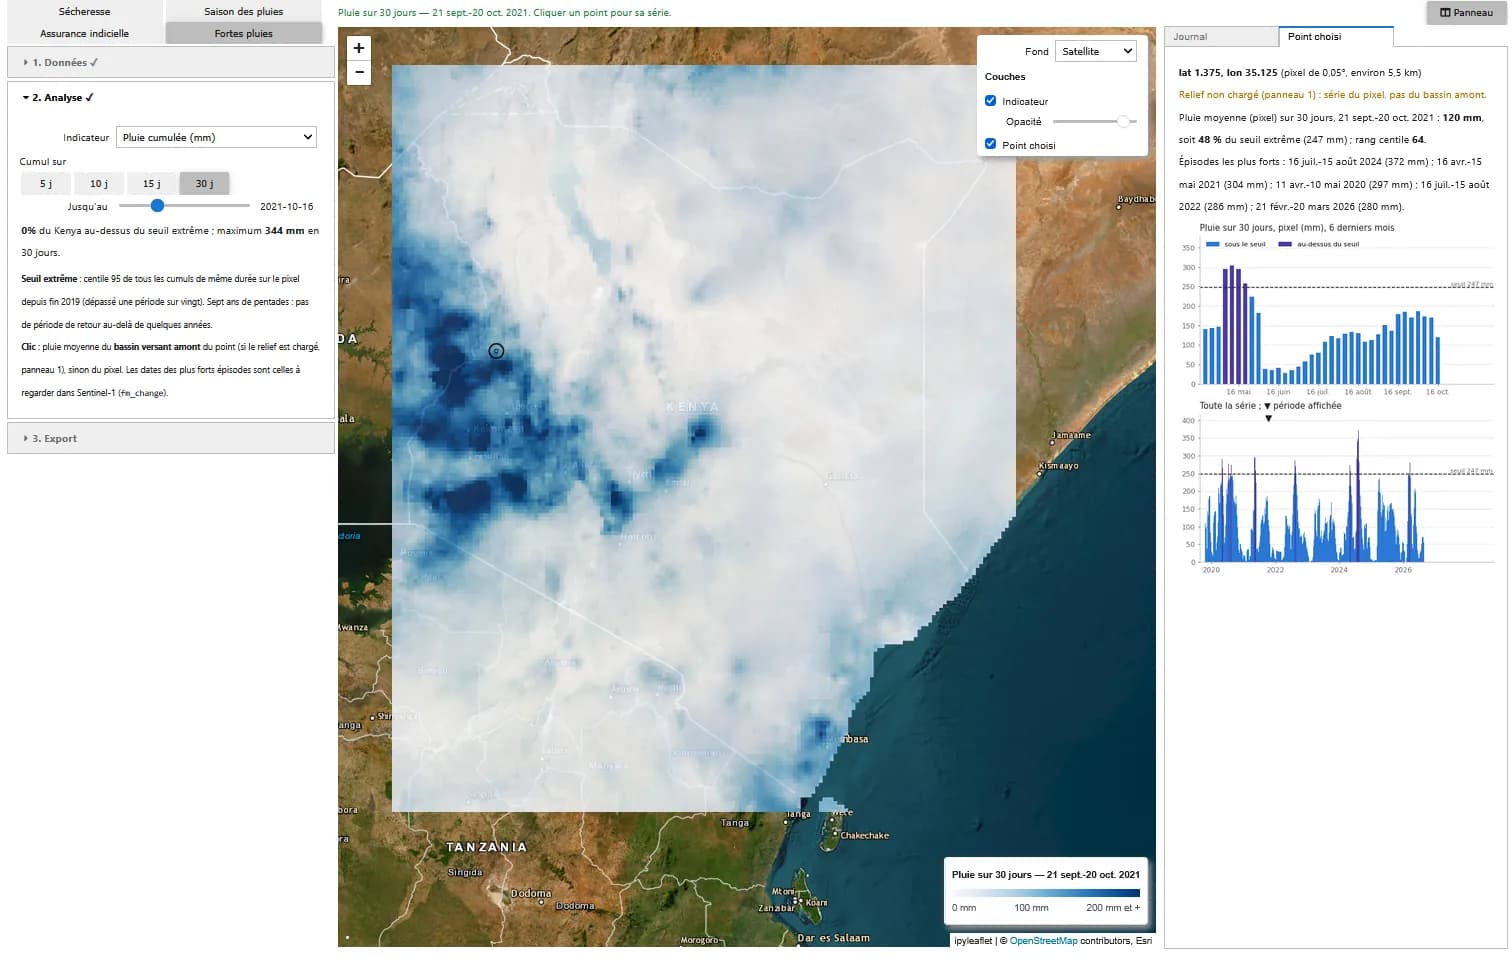
5-, 10-, 15- or 30-day totals compared with the pixel's 95th percentile. With elevation loaded, a click gives the mean rainfall of the upstream catchment and its strongest events.
How it works
01
Data
CHIRPS v3.0 (0.05°, about 5.5 km) and Copernicus DEM, read from the STAC catalogue. Incremental updates, no GPU.
02
Indicators
Per-pixel computation with NumPy and SciPy: SPI, season onset, contract replayed year by year, extreme thresholds.
03
Catchments
Elevation averaged to about 1 km, depressions filled and flow directions computed (Priority-Flood), then the catchment upstream of the clicked point.
Screenshots
Known limitations
- A twenty-year baseline, where the WMO recommends 30 years for the SPI: extreme values are less certain, the ranking of years remains reliable.
- Pentads since late 2019: six or seven seasons to compare, and no return period beyond a few years.
- Twenty seasons are not enough to price a real contract, and basis risk (rainfall estimated at 5.5 km versus rainfall in the field) is not measured.
- In arid northern and eastern Kenya, with few rain gauges, low rainfall amounts are uncertain.
Going further
- Statistics by county, with an administrative boundaries file
- Cross-analysis with Sentinel-2 NDVI
Role
- Application design
- Methods and indicators
- Development and testing
Technologies
Python · NumPy / SciPy · STAC · CHIRPS · Copernicus DEM · ipyleaflet · Voilà · JupyterHub
Context
Demonstrator designed and built in 2026 by Guillaume Rieu, author of the Earth Innovation Labs specifications, as a volunteer contribution to the acceptance testing of these platforms in Kenya for Expertise France. It runs in the platform's JupyterHub environment.
A similar need?
These demonstrators can serve as the basis for a tool adapted to your data, your area or your question.